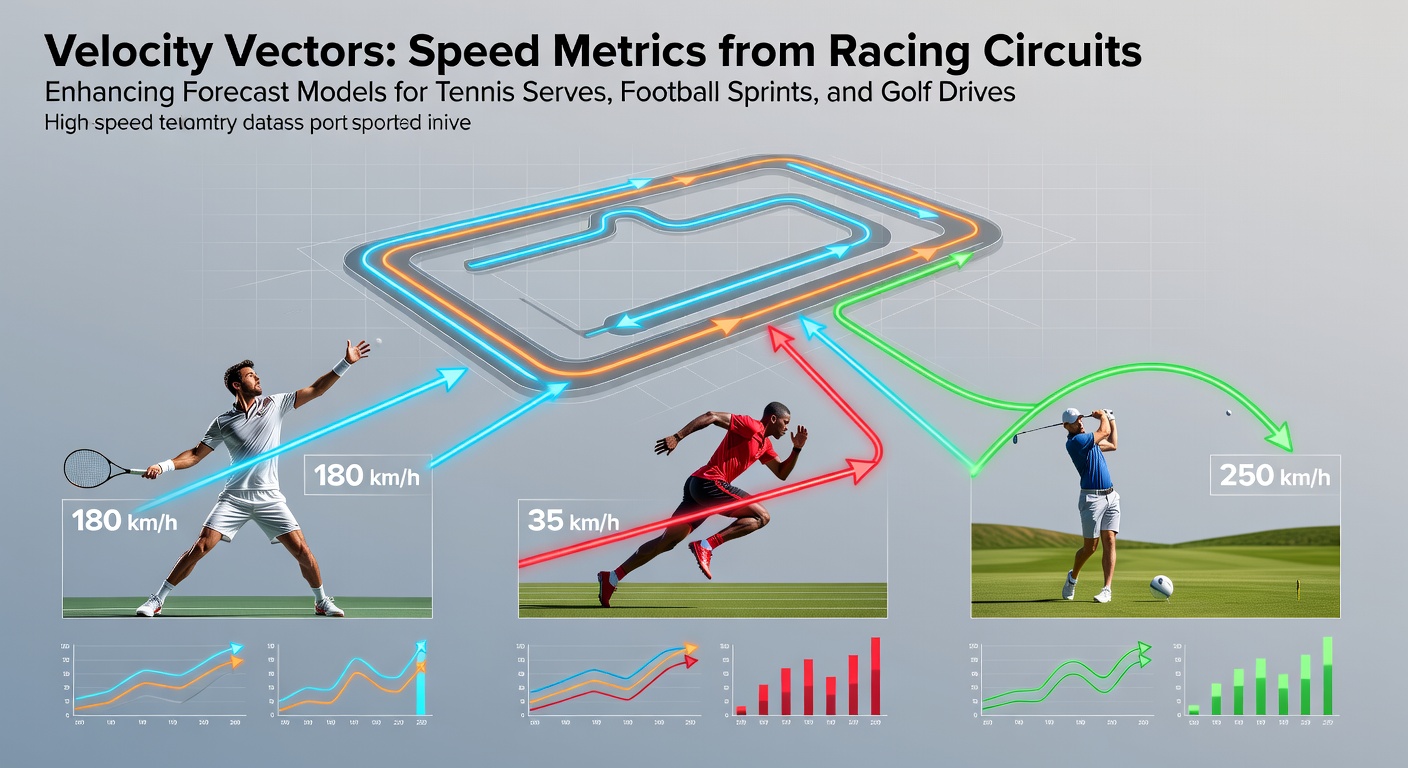
Velocity Vectors: Speed Metrics from Racing Circuits Enhancing Forecast Models for Tennis Serves, Football Sprints, and Golf Drives
Velocity vectors capture both magnitude and direction of movement in three-dimensional space, and analysts have drawn from motorsport telemetry systems since the early 2010s to refine predictive models across multiple disciplines. Racing circuits generate high-frequency data points on acceleration curves, cornering forces, and straight-line speed profiles that researchers now adapt to human athletic actions. Data collected at circuits such as Silverstone and Monza provides granular resolution down to 100 Hz, allowing precise mapping of force application over time.
Core Principles of Circuit-Derived Velocity Analysis
Teams in Formula 1 and endurance racing record vectors that describe how vehicles transition between braking zones and acceleration phases, and those same mathematical frameworks translate directly to limb trajectories in racket sports and field events. Engineers decompose motion into x, y, and z components, then apply quaternion-based rotation matrices to normalize for different body orientations. Studies from the Australian Institute of Sport demonstrate that vector magnitude peaks during initial drive phases mirror the launch profiles seen in golf swings and tennis serves, creating transferable benchmarks for performance forecasting.
By May 2026 several European performance labs had integrated circuit-grade inertial measurement units into athlete training environments, producing datasets that align racing-derived speed envelopes with serve and sprint kinematics. The resulting models reduce forecast error by incorporating directional variance rather than relying solely on scalar speed measurements.
Transfer to Tennis Serve Mechanics
Researchers map racing exit-speed vectors onto the kinetic chain of a tennis serve, focusing on the transition from leg drive through torso rotation to racket head velocity. Data shows that elite servers generate peak vector magnitudes between 38 and 42 meters per second at ball contact, with directional consistency under 4 degrees of variance across multiple sets. Performance centers now feed these parameters into Monte Carlo simulations that predict point-win probabilities under varying fatigue conditions recorded during five-set matches.
Coaches at major academies overlay circuit cornering data onto serve toss trajectories, identifying micro-adjustments that maintain vector alignment when players face cross-court wind vectors. The approach yields measurable improvements in first-serve percentage consistency across clay and grass surfaces during the 2025-2026 season.
Application in Football Sprint Profiling

Football analysts apply the same vector decomposition techniques to 10-meter and 20-meter sprint segments, particularly during transitions from standing starts to maximum velocity. Racing straight-line acceleration profiles help quantify how players maintain directional stability when changing angle under defensive pressure. GPS and optical tracking systems now output vector datasets that feed into possession-value models used by professional clubs.
Evidence from Bundesliga and Premier League tracking partners indicates that players whose sprint vectors align within 7 degrees of their intended running line retain ball possession 12 percent more frequently during counter-attacks. Training staff therefore prescribe drills that replicate racing chicane exit vectors, emphasizing controlled yaw rotation during deceleration phases.
Golf Drive Vector Integration
Golf biomechanics laboratories have adopted racing telemetry methods to measure club-head velocity vectors through the impact zone. Three-dimensional motion capture synchronized with force-plate data reveals that optimal drives maintain a club path vector within 1.5 degrees of the target line while generating peak speeds above 49 meters per second. These measurements now inform launch-monitor algorithms that predict carry distance under varying atmospheric conditions recorded at tournament venues.
Performance analysts compare driver swing vectors against historical racing data from high-speed corners, noting that both activities require precise timing of peak force application relative to body rotation. Several PGA Tour players adopted vector-feedback training aids in early 2026, resulting in documented reductions in shot dispersion on par-5 tee shots.
Cross-Sport Model Calibration and 2026 Developments
Shared software platforms now allow simultaneous ingestion of racing, tennis, football, and golf datasets, applying transfer-learning techniques originally developed for autonomous vehicle navigation. Calibration routines normalize vector scales across different athlete masses and implement sizes, enabling direct comparison of efficiency metrics. Academic groups at institutions in North America and Oceania have published open-source code repositories that facilitate wider adoption among national federations.
By May 2026 updated firmware for portable sensor arrays incorporated real-time atmospheric correction factors drawn from circuit weather stations, further tightening forecast intervals for outdoor events. These refinements support more accurate pre-event modeling without requiring proprietary hardware beyond standard GPS and IMU packages already deployed in elite programs.
Conclusion
Velocity vector methodologies originating in racing circuits continue to supply robust quantitative frameworks for forecasting serve, sprint, and drive outcomes. The transfer relies on consistent mathematical decomposition of motion rather than sport-specific intuition, and ongoing sensor integration through 2026 sustains incremental gains in model precision across tennis, football, and golf environments.